I am encountering an issue while creating a tanglegram for seasonal influenza H3 and N2, and I am seeking your assistance. Here is the code I used with augur refine in an attempt to construct a time-resolved phylogenetic tree. The earliest sequence in my dataset is dated 2019-08-27, and the latest is dated 2022-08-03. However, when I visualize the resulting tree using Auspice website, it does not display the year information as I anticipated. Is there any way I could adjust this code? Image 1 represents the outcome I desire, while Image 2 depicts the results obtained with my data, which differs in several aspects. What steps should I take to achieve a result similar to Image 1? I would be extremely grateful for your guidance. I’m really struggling with this. Thank you very much!
after I get two trees from the above codes, I drag these two files into https://auspice.us/ this website.
augur refine is intended to be used as part of a larger workflow, you can’t visualise the results of just that step the way you are tying to. Specifically, the outputs here (node-data file and refined newick tree file) should be handed to augur export v2 which will produce a JSON specifically for Auspice visualisation. You could use the zika tutorial snakefile as an example of how these are linked together, although that tutorial adds extra steps in the pipeline you may not need.
Once you are visualising the JSONs (from augur export v2) in Auspice (or auspice.us), there will be a toggle in the sidebar on the left hand side allowing you to change the tree branch metric between “time” and “divergence”
P.S. you must be dragging on an additional metadata TSV file to auspice.us in order to colour the tree by clade in your screenshot – that information isn’t encoded in the newick trees.
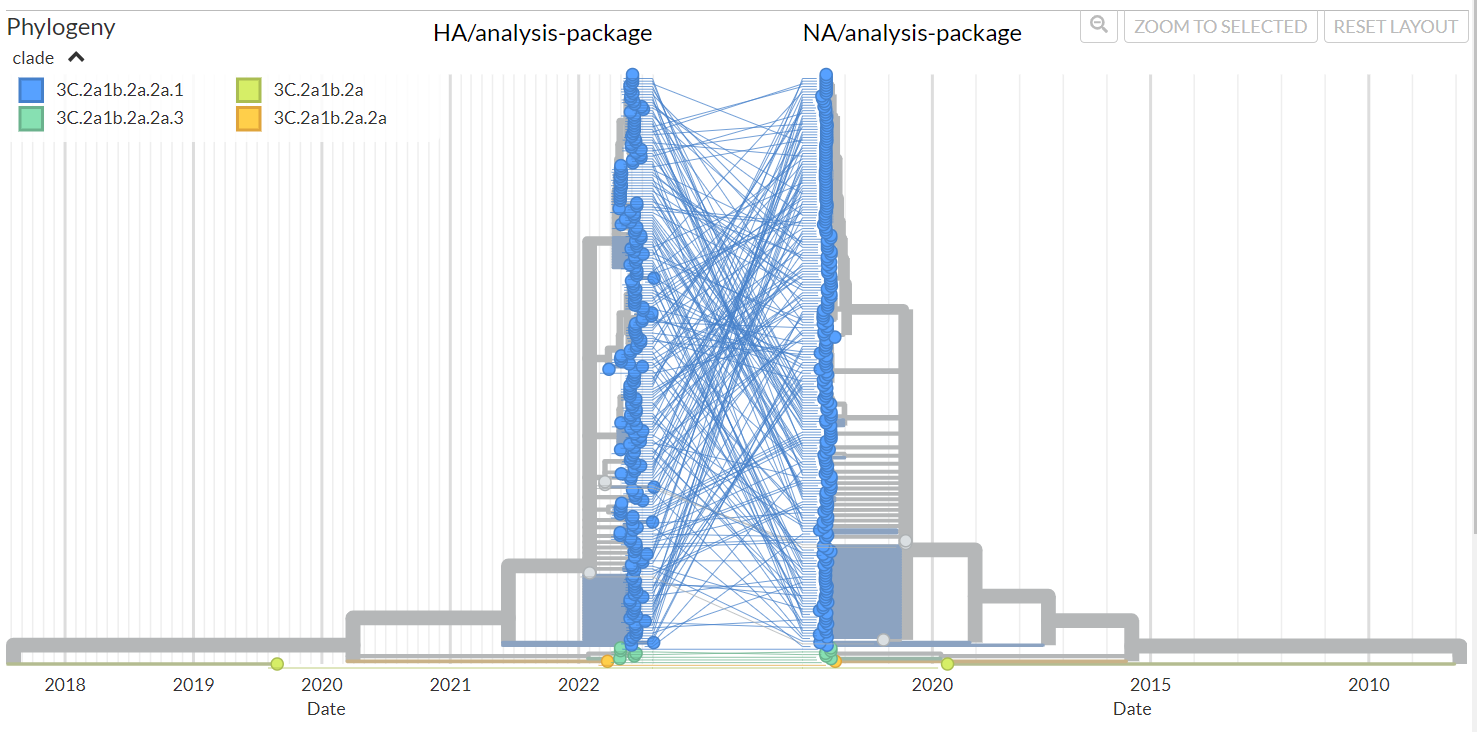
I have tried the method you suggested, and now the time is being displayed properly. Additionally, by incorporating the metadata.tsv file, the ‘color by clade’ feature is also now visible. Please refer to the attached image for details. I have encountered a minor issue: the sequence names corresponding to each tip did not show up